2.7.2.1. About the Arlington River
- East of downtown Jacksonville
- Primary Land Use: Residential
- Current TMDL reports:
Nutrients
- Current TMDL reports:
- 2022 Verified Impairment for Iron
- WBID Area: 1.6 sq. mi.
- Beneficial Use: Class III M
(Recreational – Marine)
2.7.2.2. Data sources
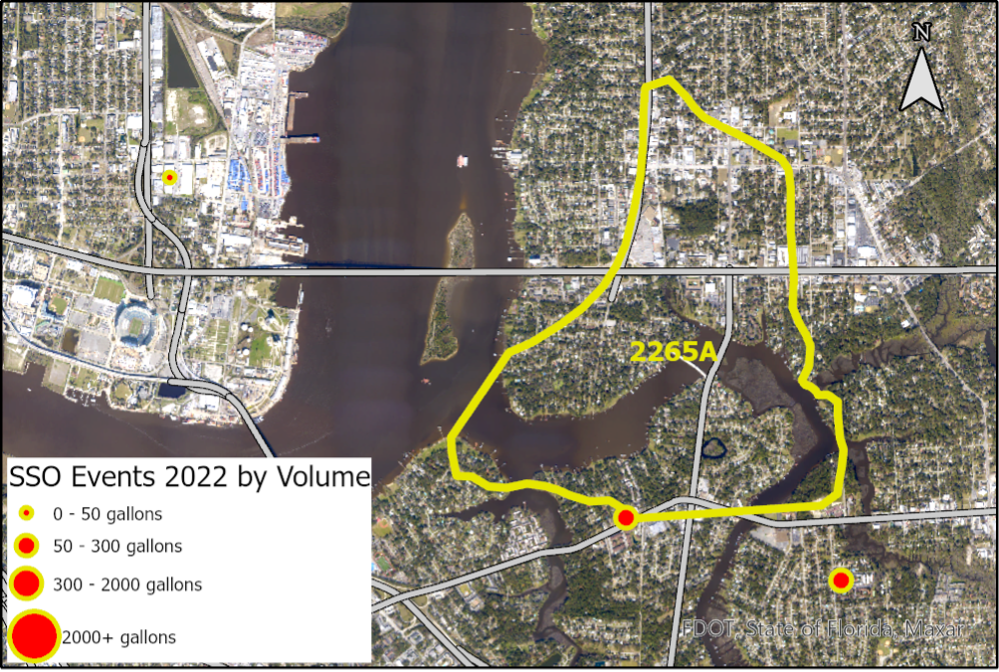
Data were historically downloaded from the FL STORET website (DEP 2010f), with recent data downloaded from WIN WAVES (DEP 2022f). Data were filtered based on the stations in the Arlington River WBID 2265A (DEP 2023b) shown above. No water quality data for the selected parameters discussed below for the Arlington River were available in WIN for 2020. The filtered dataset reflects water column concentrations and was used to generate Table 2.7.
2.7.2.3. Discussion
Water quality data for the Arlington River are presented in Table 2.7. Average phosphorus levels were historically higher than the recently updated WQC (DEP 2015c; DEP 2016d; DEP 2016i) and the tributary was listed as impaired for nutrients. Elevated levels of phosphorus may be a result of effluent from the Monterey WWTF that is discharged into the river, fertilizer runoff from the surrounding residential area, or other unidentified sources. The Arlington River was delisted (removed) from the Verified List for nutrient impairment as a result of a finalized TMDL report for nutrients in 2009 (Magley 2009c). However, the Arlington River remains impaired for nutrients until there is sufficient data to demonstrate the waterbody is meeting the applicable water quality criterion. Total phosphorus concentrations in recent years have been lower than the WQC used here of 0.12 mg/L. (Phosphorus in the Arlington River is regulated by the Nutrients TMDL, not the WQC presented here.)
The Arlington River was identified as being impaired for mercury, based on elevated levels of mercury in fish tissue; however, this has been delisted (DEP 2016f) as it has been addressed by the statewide mercury TMDL (DEP 2013c). The Arlington River is no longer listed as impaired for chlorophyll-a as that is being addressed by the Nutrients TMDL, which calls for a 30% reduction in TN compared to historical levels (DEP 2016f). However, chlorophyll-a continues to remain high, with average concentrations double the WQC in 2021-2022. The Arlington River is impaired for iron, based on the number of exceedances for the sample size; DEP cannot rule out the possibility of anthropogenic sources. In 2022, the average iron level was near the WQC, with one of five samples exceeding it.
Historical water quality data for the Arlington River are available in previous versions of the River Report.
Table 2.7 Water quality data for Arlington River.
| Water Quality | Average and Number of Samples º | |||
|---|---|---|---|---|
| Parameter | Criteria (SW) | 2020 | 2021 | 2022 |
| Dissolved Oxygen (mg/L) | ≥4.0 | Not Available | 6.40 (0 of 7 samples) | 7.05 ± 0.47 (0 of 5 samples) |
| Total Nitrogen (mg/L) | <1.54‡ | Not Available | 0.81 (0 of 2 samples) | 0.81 ± 0.08 (0 of 5 samples) |
| Total Phosphorus (mg/L) | <0.12‡ | Not Available | 0.10 (1 of 7 samples) | 0.08±0.002 (0 of 5 samples) |
| Chlorophyll-a (µg/L) | <5.4‡ | Not Available | 10.51 (5 of 7 samples) | 12.28 ± 4.32 (4 of 5 samples) |
| Arsenic (µg/L) | ≤50 | Not Available | Not Available | 1.85 ± 0.18 (0 of 5 samples) |
| Cadmium (µg/L) | ≤8.8 | Not Available | Not Available | 0.03 ± 0.01 (0 of 5 samples) |
| Copper (µg/L) | ≤3.7 | Not Available | Not Available | 0.98 ± 0.12 (0 of 5 samples) |
| Iron (µg/L) | ≤0.3 | Not Available | Not Available | 0.23 ± 0.06 (1 of 5 samples) |
| Lead (µg/L) | ≤8.5 | Not Available | Not Available | 0.68 ± 0.13 (0 of 5 samples) |
| Nickel (µg/L) | ≤8.3 | Not Available | Not Available | 1.90 ± 0.78 (0 of 5 samples) |
| Silver (µg/L) | ≤0.92 | Not Available | Not Available | 0.01 ± 0.004 (0 of 5 samples) |
| Zinc (µg/L) | ≤86 | Not Available | Not Available | 5.50 ± 1.23 (0 of 5 samples) |
| Fecal Indicator Bacteria (Enterococci) (CFU/100 mL) | <130 | Not Available | 500 (3 of 4 samples) | 36 ± 13 (0 of 3 samples) |
| Turbidity (NTU) | <29 | Not Available | 9.53 (0 of 4 samples) | 5.74 ± 1.19 (0 of 5 samples) |
° = Number of samples below Water Quality Criteria for Dissolved Oxygen; Number of samples above Water Quality Criteria for all other parameters.
FW = freshwater; SW = saltwater (marine). Values denoted with (*) indicate a proposed criterion, which has not yet been adopted.
Values denoted with (‡) are reference values based on EPA criteria (EPA 2010b), but the water body is not regulated by this standard.